
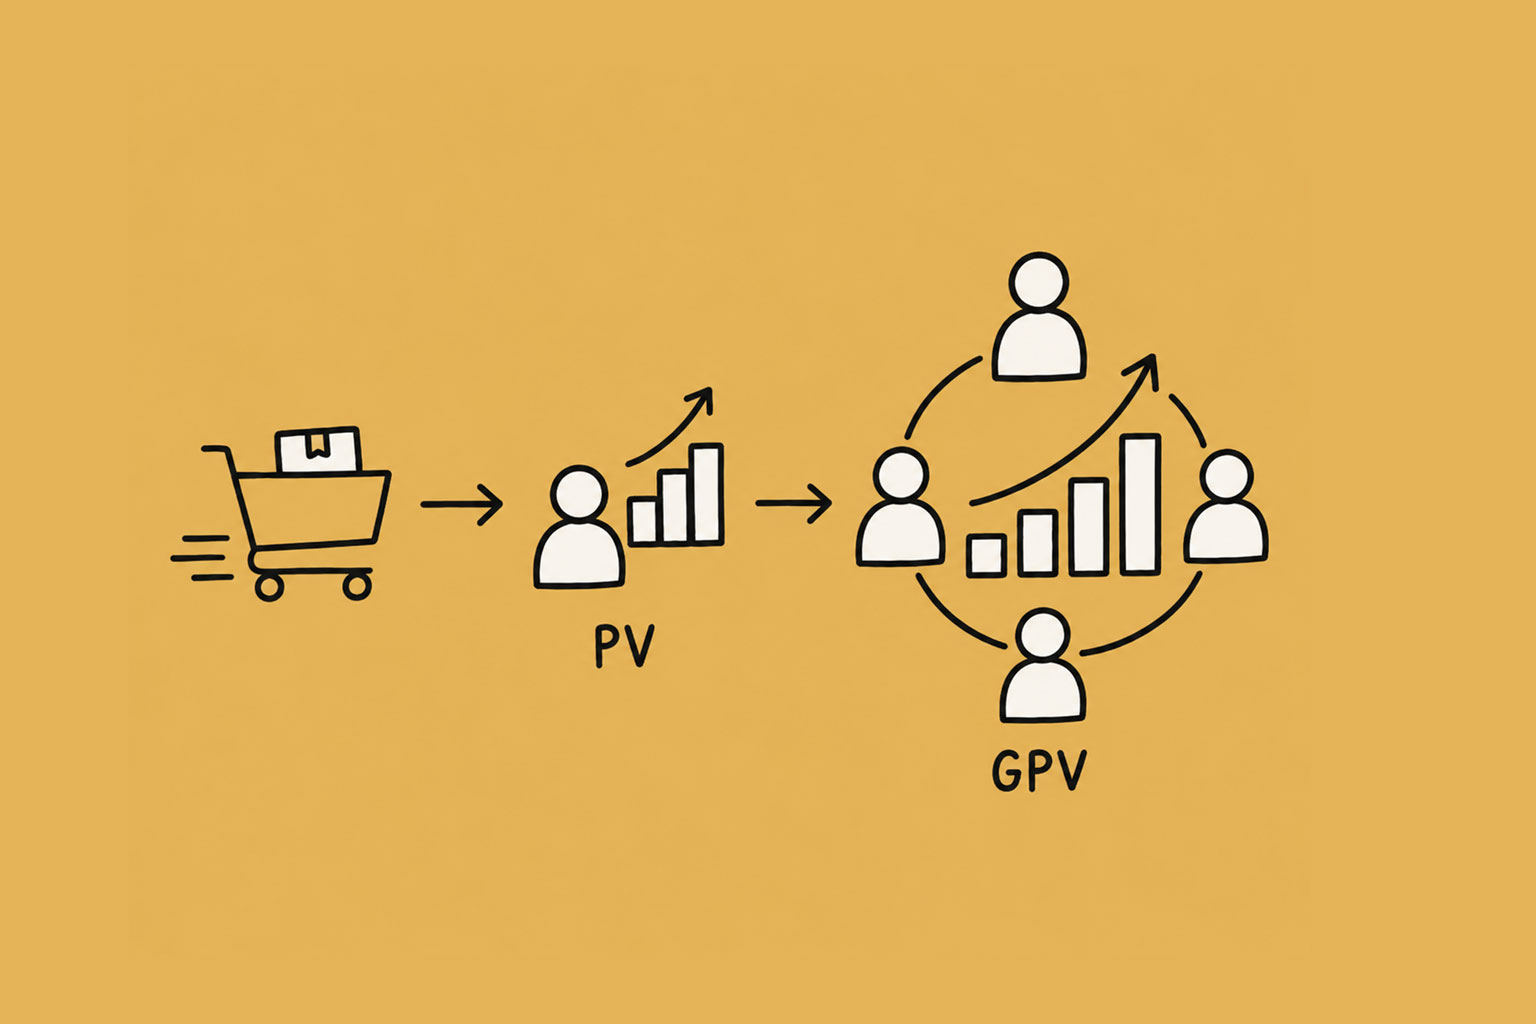
Here is a number that should make every direct selling founder sit up: consumer packaged goods companies spend about 20% of their revenue on trade promotions — slotting fees, retailer discounts, end-cap placements — and research consistently finds that most of these promotions lose money, with the figure reaching 72% of promotions in the US market. That is the price of influencing a sales channel you don’t control. A direct selling company is in a structurally different position: your channel’s attention is steered by the PV table and your leaders’ behaviour by GPV rules, both of which you own outright. The earlier posts in this series covered each instrument in isolation — PV’s margin and campaign mechanics, GPV’s flow rules and alignment effects. This one is about running them together, as a single demand management system with a forecast, a dashboard, and a cadence.
## Two Dials, Two Frequencies
The system has a fast dial and a slow dial, and confusing their speeds is the most common operating error.
**PV is the fast dial.** It acts at the product level and the network responds within days — distributors read PV-per-rupee the way traders read spreads, and volume shifts toward whatever the table currently favours. It’s the right instrument for anything with a time horizon of weeks to a quarter: launches, inventory corrections, bundle-building, seasonal pulses.
**GPV rules are the slow dial.** Activity floors, rank thresholds, leg requirements, and compression settings shape how the *organisation* grows — depth versus width, coaching versus recruiting, baseline volume per member. The network responds over months, because people are re-planning careers, not shopping carts. Touch this dial rarely and announce it loudly; changing rank requirements feels to your field the way changing pension rules feels to employees.
The operating discipline follows directly: PV changes can be routine and data-driven; GPV changes are governance events with communication plans. Companies that yank the slow dial for fast-dial problems — raising rank thresholds because one quarter looked soft — burn trust to solve a problem the PV table could have handled quietly.
## The Thermostat, Not the Throttle
A useful mental model: you are not driving demand, you are setting the temperature and letting the network find equilibrium. The thermostat has three settings working simultaneously:
– **The floor sets the baseline.** Monthly activity requirements across your active member count give you a minimum volume you can plan production against. This is your forecastable core.
– **The PV table sets the mix.** Which products absorb the network’s selling energy this quarter — the steering function.
– **GPV thresholds set the growth pattern.** How much of the network’s effort flows into expansion (recruiting, developing legs) versus consolidation (deepening retail in existing teams).
The interaction is where founders get surprised. Raise a rank’s GPV requirement and you haven’t just made ranks harder — you’ve increased demand pressure across every team chasing that rank, which shows up as volume, some of it healthy retail push and some of it qualification buying. Boost a product’s PV during the same period and the two effects multiply on that SKU. Every dial movement propagates through the same network; model them together or the combined effect will model you.
## Building the Baseline Forecast
Demand management without a baseline is superstition. The minimum viable model has three layers, each derivable from your own data:
– **Floor volume**: active members × activity requirement × historical compliance rate. Not 100% of members hit the floor; your genealogy data tells you the real rate, and its trend is itself a health metric.
– **Qualification-seeking volume**: members within striking distance of a rank threshold reliably over-index in the closing weeks of a period. Count who’s within, say, 15% of a threshold and apply their historical conversion behaviour. This layer is why volume in rank-driven networks is lumpy by design.
– **Campaign lift**: the incremental volume your PV campaigns have historically produced per point of boost, by category — the measurement discipline from earlier in this series feeding forward into planning.
Stack the three layers and you have something most consumer brands would envy: a demand forecast built from incentive structures you control, rather than from guessing what a retailer’s shoppers might do. It will be wrong — all forecasts are — but it will be wrong in inspectable ways, and each miss improves a model you own.
## The Signals Dashboard
Five numbers, watched monthly, tell you whether the system is healthy or drifting:
– **Floor compliance rate** — falling compliance is your earliest churn signal, visible before members formally lapse.
– **PV-to-revenue ratio across the catalogue** — if the network’s volume is migrating toward high-PV/low-margin SKUs faster than you intended, your table is mispriced somewhere.
– **Qualification-buying share** — end-of-period volume spikes concentrated in self-purchases rather than retail orders mean your thresholds are manufacturing demand instead of channelling it. This is the line between demand management and inventory loading, and regulators read it the same way you should.
– **Campaign decay** — each successive PV boost on the same SKU producing less lift means the network is habituating; rest the instrument.
– **Payout ratio versus plan** — total commissions as a share of PV-adjusted revenue, tracked against the theoretical maximum. Drift here means a dial is set somewhere you don’t think it is.
## The Quarterly Cadence
The system runs best on a rhythm rather than reactions:
– **Monthly**: read the dashboard; adjust nothing unless a signal breaches its band.
– **Quarterly**: review the PV table product-by-product against margin and velocity; plan next quarter’s one or two campaigns; retire what decayed.
– **Annually**: revisit the slow dial — floors, rank thresholds, leg rules — once, with field leadership consulted and changes announced with a full period’s notice.
This cadence is only possible when the dials and the data live in the same place you do. A platform where PV edits go through a vendor queue, or where genealogy data can’t be queried freely, turns a Tuesday-afternoon adjustment into a project. MLMOrbit’s answer is structural: the PV table, GPV configuration, and every order and payout record sit in your own database on your own server, so the thermostat, the forecast, and the dashboard are things you operate — not features you request.
Traditional brands rent demand influence from their channel at 20% of revenue and lose money on most of the transactions; a direct selling company that runs PV and GPV deliberately gets the same influence as a built-in property of the channel itself. Treat the two as one system — fast dial for mix, slow dial for structure, a layered baseline underneath, five signals on top, and a cadence that keeps your hands off the controls between readings. Do that, and demand stops being the thing that happens to your company each month and becomes the thing your company quietly sets.


0 Comments